
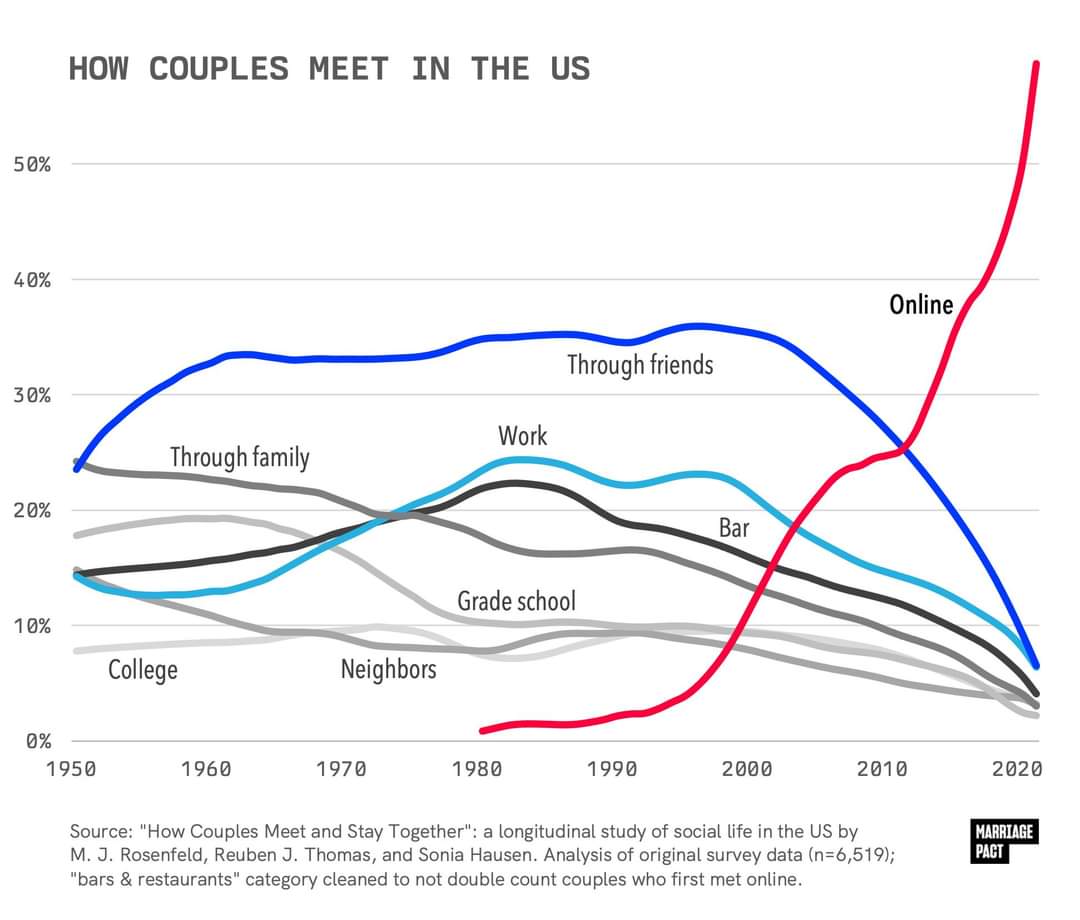
It’s been trending this way for years, but seeing it graphed out like this is shocking.
What do you think are the effects of this drastic change?
It’s been trending this way for years, but seeing it graphed out like this is shocking.
What do you think are the effects of this drastic change?
I think this is the data collection info: https://data.stanford.edu/hcmst2017
Half of all randomly selected subjects (by address) responded to their survey? I’d need to read a bit more about what exactly is going on there.